Member Advisory Council ICT Assessments

July 15, 2022, I have been appointed by the cabinet of the Dutch government as a member of the Advisory Council ICT Assessments (AcICT), starting September 1st, 2022. I am happy, and honored, with this appointment!

The task of the council is as follows (my own translation):

The Advisory Council ICT Assessments judges risks and the chance of success of ICT (Information and Communication Technology) projects within the Dutch national government, and offers advice for improvement. It also assesses the effectiveness and efficiency of the maintenance and management of information systems. The council consists of experts, from academia and industry, who have administrative, supervisory and management experience with regard to the realization, deployment and control of ICT processes.

Ministeries submit any project with an ICT-component of over 5 million Euros to the council. Based on a risk assessment, the council subsequently decides whether it conducts an investigation.

Since 2015, almost 100 assessments have been conducted, on various domains. Recent examples include high school exams, governmental treasury banking, vehicle taxes, and the development process of the Dutch Covid-19 tracking app.

The resulting assessment reports are 7-8 pages long, centered around a number (typically three) of core risks, followed by specific recommendations (also often three) on how to address these risks. Example risks from recent reports include:

  • “Key project results are not yet complete in the final stages of the project” (treasury)
  • “An unnecessarily fine-grained solution takes too much time” (exams)
  • “The program needs to realize too many changes simultaneously” (vehicle taxes)

The corresponding recommendations:

  1. “Work towards a fallback scenario so that the old system can remain in operation until the new system is demonstrably stable” (treasury)
  2. “Establish how to simplify the solution” (exams)
  3. “Reduce the scope” (vehicle taxes)

The assessments are prepared by a team of presently around 20 ICT researchers and research managers. When needed, external researchers with specific expertise are consulted. Assessments follow an assessment framework, which distinguishes nine risk areas (such as scope, architecture, implementation, and acceptance).

The assessments serve to support political decision making, and are focused on the Dutch parliament and ministers. For each assessment, the minister in question offers a formal reaction, also available from the council’s web site. This serves to help parliament to fullfil their responsibility of checking the executive ministers.

The council consists of five members, each involved part time (for one day per week), for a period of four years, each bringing their own dedicated expertise. For me personally, I see a strong connection with my research and education at the TU Delft, in such areas as software architecture, software testing, and developer productivity.

As a computer scientist, I consider responsible, transparent, and cost-effective digitalization of great importance for the (Dutch) democracy and society. The advisory council fulfills a unique and important role, which is closely connected to my interests in software engineering. I look forward, together with my new colleagues from the AcICT, to contributing to the improvement of the digitalizations of the Dutch government.

I am presently not aware of comparable councils in other countries, in Europe or elsewhere. If you know of similar institutions in your own country, please let me know!

Lid Adviescollege ICT-toetsing

Op 15 juli 2022 ben ik door de ministerraad benoemd als lid van het Adviescollege ICT-toetsing (AcICT), op voorstel van staatssecretaris Van Huffelen van Koninkrijksrelaties en Digitalisering, per 1 september 2022. Ik ben blij en vereerd met deze benoeming!

De opdracht van dit college is:

Het Adviescollege ICT-toetsing oordeelt over de risico’s en de slaagkans van ICT (Informatie- en Communicatie Technologie) projecten binnen de Rijksoverheid en geeft adviezen ter verbetering. Ook toetst het de doeltreffendheid en doelmatigheid van onderhoud en beheer van informatiesystemen. Het adviescollege bestaat uit deskundigen – uit de wetenschappelijke wereld en het bedrijfsleven – die beschikken over bestuurlijke, toezichthoudende en managementervaring met betrekking tot realisatie, inzet en beheersing van ICT-trajecten.

Ministeries melden elk project met een ICT-component van meer dan 5 miljoen Euro bij het Adviescollege aan. Op basis van een risicoanalyse beslist het AcICT vervolgens of het een onderzoek uitvoert.

Sinds 2015 (toen nog als Bureau ICT-toetsing — BIT) zijn bijna honderd onderzoeken uitgevoerd, recent bijvoorbeeld over het moderniseren van examens, het digitaliseren van schatkistbankieren, het rationaliseren van de motorrijtuigenbelasting, en het ontwikkelproces van de Coronamelder app.

De meeste adviezen zijn 7-8 pagina’s in omvang, en zijn opgebouwd rond een kern van (vaak drie) belangrijke risico’s, gevolgd door enkele (ook vaak drie) concrete adviezen hoe de koers bij te stellen in het licht van deze risico’s. Genoemde risico’s zijn bijvoorbeeld:

  1. "Cruciale projectresultaten nog niet gereed zijn in het eindstadium van het project" (Schatkistbankieren)
  2. "Onnodig fijnmazige oplossing kost veel tijd" (Examens)
  3. "Het programma moet te veel veranderingen tegelijk realiseren" (Motorrijtuigenbelasting)

Met bijbehorend advies:

  1. "Werk een terugvalscenario uit zodat het oude systeem blijft functioneren totdat het nieuwe systeem aantoonbaar stabiel is." (Schatkistbankieren)
  2. "Identificeer hoe de oplossing eenvoudiger kan" (Examens)
  3. "Beperk de scope" (Motorrijtuigenbelasting)

De adviezen worden voorbereid door een team van (op dit moment) circa 20 ICT-onderzoekers en -onderzoeksmanagers. Waar nodig worden ook externe onderzoekers met specifieke expertise ingezet. Leidraad voor elk onderzoek is het toetskader, waarin negen risicogebieden (zoals bijv. scope, architectuur, realisatie, en acceptatie) worden onderscheiden.

De adviezen dienen ter ondersteuning van de politieke besluitvorming, en zijn dus gericht op de Eerste en Tweede Kamer en de ministers en staatssecretarissen. De minister reageert op het onderzoek van het AcICT middels een brief die ook openbaar is (en ook te vinden op de AcICT website), waarna het parlement de adviezen en de bestuurlijke reactie kan controleren.

Het Adviescollege zelf telt vijf leden, elk met hun eigen expertise, die dit werk in deeltijd doen (één dag per week), voor een periode van vier jaar. Voor mij zie ik een mooie aansluiting bij mijn onderzoek en onderwijs aan de TU Delft, bijvoorbeeld op het gebied van software-architectuur, software-testen, en efficiëntie van het software-ontwikkelproces.

Verantwoorde, transparante, en kosten-effectieve digitalisering is van groot belang voor de Nederlandse democratie en samenleving. In het realiseren hiervan speelt het Adviescollege een belangrijke rol, en ik wil me dus graag inzetten voor het AcICT.

Ik zie ook een mooie connectie tussen de taken van het Adviescollege en mijn eigen kennis en ervaring op het gebied van software engineering. Ik kijk er naar uit om, samen met de nieuwe collega’s van het AcICT, een bijdrage te leveren aan de succesvolle digitalisering van de Nederlandse overheid.

Delft Students on Software Architecture: DESOSA 2015

With Rogier Slag.

This year, we taught another edition of the TU Delft Teaching Software Architecture — With GitHub course.

We are proud to announce the resulting on line book: Delft Students on Software Architecture is a collection of architectural descriptions of open source software systems written by students from Delft University of Technology during a master-level course taking place in the spring of 2015.

desosa 2015 book cover

At the start of the course, teams of 3-4 students could adopt a project of choice on GitHub. The projects selected had to be sufficiently complex and actively maintained (one or more pull requests merged per day).

During a 10 week period, the students spent one third of their time on this course,and engaged with these systems in order to understand and describe their software architecture.

Inspired by Brown and Wilsons’ Architecture of Open Source Applications, we decided to organize each description as a chapter, resulting in the present online book.

Recurring Themes

The chapters share several common themes, which are based on smaller assignments the students conducted as part of the course. These themes cover different architectural ‘theories’ as available on the web or in textbooks. The course used Rozanski and Woods’ Software Systems Architecture, and therefore several of their architectural viewpoints and perspectives recur.

The first theme is outward looking, focusing on the use of the system. Thus, many of the chapters contain an explicit stakeholder analysis, as well as a description of the context in which the systems operate. These were based on available online documentation, as well as on an analysis of open and recently closed issues for these systems.

A second theme involves the development viewpoint, covering modules, layers, components, and their inter-dependencies. Furthermore, it addresses integration and testing processes used for the system under analysis.

A third recurring theme is variability management. Many of today’s software systems are highly configurable. In such systems, different features can be enabled or disabled, at compile time or at run time. Using techniques from the field of product line engineering, several of the chapters provide feature-based variability models of the systems under study.

A fourth theme is metrics-based evaluation of software architectures. Using such metrics architects can discuss (desired) quality attributes (performance, scaleability, maintainability, …) of a system quantitatively. Therefore various chapters discuss metrics and in some cases actual measurements tailored towards the systems under analysis.

First-Hand Experience

Last but not least, the chapters are also based on the student’s experience in actually contributing to the systems described. As part of the course over 75 pull requests to the projects under study were made, including refactorings (Jekyll 3545, Docker 11350, Docker 11323, Syncany 391), bug fixes
(Diaspora 5714, OpenRA 7486, OpenRA 7544, Kodi 6570), and helpful documentation such as a Play Framework screen cast.

Through these contributions the students often interacted with lead developers and architects of the systems under study, gaining first-hand experience with the architectural trade-offs made in these systems.

Enjoy!

Working with the open source systems and describing their architectures has been a great experience, both for the teachers and the students.

We hope you will enjoy reading the DESOSA chapters as much as we enjoyed writing them.

Think Twice Before Using the “Maintainability Index”

Code metrics results in VS2010

This is a quick note about the “Maintainability Index”, a metric aimed at assessing software maintainability, as I recently run into developers and researchers who are (still) using it.

The Maintainability Index was introduced at the International Conference on Software Maintenance in 1992. To date, it is included in Visual Studio (since 2007), in the recent (2012) JSComplexity and Radon metrics reporters for Javascript and Python, and in older metric tool suites such as verifysoft.

At first sight, this sounds like a great success of knowledge transfer from academic research to industry practice. Upon closer inspection, the Maintainability Index turns out to be problematic.

The Original Index

The Maintainabilty Index was introduced in 1992 by Paul Oman and Jack Hagemeister, originally presented at the International Conference on Software Maintenance ICSM 1992 and later refined in a paper that appeared in IEEE Computer. It is a blend of several metrics, including Halstead’s Volume (HV), McCabe’s cylcomatic complexity (CC), lines of code (LOC), and percentage of comments (COM). For these metrics, the average per module is taken, and combined into a single formula:

formula

To arrive at this formula, Oman and Hagemeister started with a number of systems from Hewlett-Packard (written in C and Pacscal in the late 80s, “ranging in size from 1000 to 10,000 lines of code”). For each system, engineers provided a rating (between 1-100) of its maintainability. Subsequently, 40 different metrics were calculated for these systems. Finally, statistical regression analysis was applied to find the best way to combine (a selection of) these metrics to fit the experts’ opinion. This eventually resulted in the given formula. The higher its value, the more maintainable a system is deemed to be.

The maintainability index attracted quite some attention, also because the Software Engineering Institute (SEI) promoted it, for example in their 1997 C4 Software Technology Reference Guide. This report describes the Maintainability Index as “good and sufficient predictors of maintainability”, and “potentially very useful for operational Department of Defense systems”. Furthermore, they suggest that “it is advisable to test the coefficients for proper fit with each major system to which the MI is applied.”

Use in Visual Studio

Visual Studio Code Metrics were announced in February 2007. A November 2007 blogpost clarifies the specifics of the maintainability index included in it. The formula Visual Studio uses is slightly different, based on the 1994 version:

Maintainability Index =
  MAX(0, (171 - 5.2 * ln(Halstead Volume)
             - 0.23 * Cyclomatic Complexity
             - 16.2 * ln(Lines of Code)
         ) * 100 / 171)

As you can see, the constants are literally the same as in the original formula. The new definition merely transforms the index to a number between 0 and 100. Also, the comment metrics has been removed.

Furthermore, Visual Studio provides an interpretation:

MI >= 20 High Maintainabillity
10 <= MI < 20 Moderate Maintainability
MI < 10 Low Maintainability


I have not been able to find a justification for these thresholds. The 1994 IEEE Computer paper used 85 and 65 (instead of 20 and 10) as thresholds, describing them as a good “rule of thumb”.

The metrics are available within Visual Studio, and are part of the code metrics power tools, which can also be used in a continuous integration server.

Concerns

I encountered the Maintainability Index myself in 2003, when working on Software Risk Assessments in collaboration with SIG. Later, researchers from SIG published a thorough analysis of the Maintainability Index (first when introducing their practical model for assessing maintainability and later as section 6.1 of their paper on technical quality and issue resolution).

Based on this, my key concerns about the Maintainability Index are:

  1. There is no clear explanation for the specific derived formula.
  2. The only explanation that can be given is that all underlying metrics (Halstead, Cyclomatic Complexity, Lines of Code) are directly correlated with size (lines of code). But then just measuring lines of code and taking the average per module is a much simpler metric.
  3. The Maintainability Index is based on the average per file of, e.g., cyclomatic complexity. However, as emphasized by Heitlager et al, these metrics follow a power law, and taking the average tends to mask the presence of high-risk parts.
  4. The set of programs used to derive the metric and evaluate it was small, and contained small programs only.
  5. Furthermore, the programs were written in C and Pascal, which may have rather different maintainability characteristics than current object-oriented languages such as C#, Java, or Javascript.
  6. For the experiments conducted, only few programs were analyzed, and no statistical significance was reported. Thus, the results might as well be due to chance.
  7. Tool smiths and vendors used the exact same formula and coefficients as the 1994 experiments, without any recalibration.

One could argue that any of these concerns is reason enough not to use the Maintainability Index.

These concerns are consistent with a recent (2012) empirical study, in which one application was independently built by four different companies. The researchers used these systems two compare maintainability and several metrics, including the Maintainability Index. Their findings include that size as a measure of maintainability has been underrated, and that the “sophisticated” maintenance metrics are overrated.

Think Twice

In summary, if you are a researcher, think twice before using the maintainability index in your experiments. Make sure you study and fully understand the original papers published about it.

If you are a tool smith or tool vendor, there is not much point in having several metrics that are all confounded by size. Check correlations between the metrics you offer, and if any of them are strongly correlated pick the one with the clearest and simplest explanation.

Last but not least, if you are a developer, and are wondering whether to use the Maintainability Index: Most likely, you’ll be better off looking at lines of code, as it gives easier to understand information on maintainability than a formula computed over averaged metrics confounded by size.

Further Reading

  1. Paul Omand and Jack Hagemeister. “Metrics for assessing a software system’s maintainability”. Proceedings International Conference on Software Mainatenance (ICSM), 1992, pp 337-344. (doi)
  2. Paul W. Oman, Jack R. Hagemeister: Construction and testing of polynomials predicting software maintainability. Journal of Systems and Software 24(3), 1994, pp. 251-266. (doi).
  3. Don M. Coleman, Dan Ash, Bruce Lowther, Paul W. Oman. Using Metrics to Evaluate Software System Maintainability. IEEE Computer 27(8), 1994, pp. 44-49. (doi, postprint)
  4. Kurt Welker. The Software Maintainability Index Revisited. CrossTalk, August 2001, pp 18-21. (pdf)
  5. Maintainability Index Range and Meaning. Code Analysis Team Blog, blogs.msdn, 20 November 2007.
  6. Ilja Heitlager, Tobias Kuipers, Joost Visser. A practical model for measuring maintainability. Proceedings 6th International Conference on the Quality of Information and Communications Technology, 2007. QUATIC 2007. (scholar)
  7. Dennis Bijlsma, Miguel Alexandre Ferreira, Bart Luijten, and Joost Visser. Faster Issue Resolution with Higher Technical Quality of Software. Software Quality Journal 20(2): 265-285 (2012). (doi, preprint). Page 14 addresses the Maintainability Index.
  8. Khaled El Emam, Saida Benlarbi, Nishith Goel, and Shesh N. Rai. The Confounding Effect of Class Size on the Validity of Object-Oriented Metrics. IEEE Transactions on Software Engineering, 27(7):630:650, 2001. (doi, preprint)
  9. Dag Sjøberg, Bente Anda, and Audris Mockus. Questioning software maintenance metrics: a comparative case study. Proceedings of the ACM-IEEE international symposium on Empirical software engineering and measurement (ESEM), 2012, pp. 107-110. (doi, postprint).
Edit September 2014

Included discussion on Sjøberg’s paper, the thresholds in Visual Studio, and the problems following from averaging in a power law.


© Arie van Deursen, August 2014.

Test Coverage: Not for Managers?

Last week I was discussing how one of my students could use test coverage analysis in his daily work. His observation was that his manager had little idea about coverage. Do managers need coverage information? Can they do harm with coverage numbers? What good can project leads do with coverage data?

For me, coverage analysis is first and foremost a code reviewing tool. Test coverage information helps me to see which code has not been tested. This I can use to rethink

  1. The test suite: How can I extend the test suite to cover the corner cases that I missed?
  2. The test strategy: Is there a need for me to extend my suite to cover the untested code? Why did I miss it?
  3. The system design: How can I refactor my code so that it becomes easier to test the missing cases?
  4. An incoming change (pull request): Is the contributed code well tested?

Coverage is not a management tool. While coverage information is essential to have good discussions on testing, using test coverage percentages to manage a project calls for caution.

To appreciate why managing by coverage numbers is problematic, let’s look at four common pitfalls of using software metrics in general, and see how they apply to test coverage as well.

Coverage Without Context

A coverage number gives a percentage of statements (or classes, methods, branches, blocks, …) in your program hit by the test suite. But what does such a number mean? Is 80% good or not? When is it good? Why is it good? Should I be alarmed at anything below 50%?

The key observation is that coverage numbers should not be leading: coverage targets (if used at all) should be derived from an overall project goal. For example:

  • We want a well-designed system. Therefore we use coverage analysis to discover classes that are too hard to test and hence call for refactoring;
  • We want to make sure we have meaningful tests in place for all critical behavior. Therefore, we analyze for which parts of this behavior no such tests are in place.
  • We have observed class Foo is bug prone. Hence we monitor its coverage, and no change that decreases its coverage is allowed.
  • For the avionics software system we are building, we need to comply with standard DO178b. Thus, we must demonstrate that we achieve modified condition/decision coverage;

With these higher level goals in place, it is also possible to argue when low coverage is acceptable:

  • These packages are deprecated, so we do not need to rethink the test suite nor its design anymore.
  • These classes take care of the user interface, which we do not consider critical for our application
  • These classes are so simple that we deem automated testing unnecessary.
  • This code has been stable for years, so we do not really care anymore how well it is tested.

Code coverage is a means to an end; it is not a goal in itself.

Treating The Numbers

The number one reason developers are wary of managers using coverage numbers is that it may give incentives to write useless tests.

Measuring Snow

src: flickr

Coverage numbers are easily tricked. All one needs to do is invoke a few methods in the test cases. No need for assertions, or any meaningful verification of the outcomes, and the coverage numbers are likely to go up.

Test cases to game coverage numbers are dangerous:

  1. The resulting test cases are extremely weak. The only information they provide is that a certain sequence of calls does not lead to an unexpected exception.

  2. The faked high coverage may give a false sense of confidence;

  3. The presence of poor tests undermines the testing culture in the team.

Once again: A code coverage percentage is not a goal in itself: It is a means to an end.

One-Track Coverage

There is little information that can be derived from the mere knowledge that a test suite covers 100% of the statements. Which data values went through the statements? Was my if-then conditional exercised with a true as well as a false value? What happens if I invoke my methods in a different order?

Marter track in snow

src: flickr

A lot more information can be derived from the fact that the test suite achieves, say, just 50% test coverage. This means that half of your code is not even touched by the test suite. The number tells you that you cannot use your test suite to say anything about the quality of half of your code base.

As such, statement coverage can tell us when a test suite is inadequate, but it can never tell us whether a test suite is adequate.

For this reason, a narrow focus on a single type of coverage (such as statement coverage) is undesirable. Instead, a team should be aware of a range of different coverage criteria, and use them where appropriate. Example criteria include decision coverage, state transition coverage, data-flow coverage, or mutation coverage — and the only limitation is our imagination, as can be seen from Cem Kaner’s list of 101 coverage metrics, compiled in 1996.

The latter technique, mutation coverage, may help to fight gaming of coverage numbers. The idea is to generate mutations to the code under test, such as the negation of Boolean conditions or integer outcomes, or modifications of arithmetic expressions. A good test suite should trigger a failure for any such ‘erroneous’ motivation. If you want to experiment with mutation testing in Java (or Scala), you might want to take a look at the pitest tool.

Coverage Galore

A final pitfall in using coverage metrics is to become over-enthusiastic, measuring coverage in many (possibly overlapping) ways.

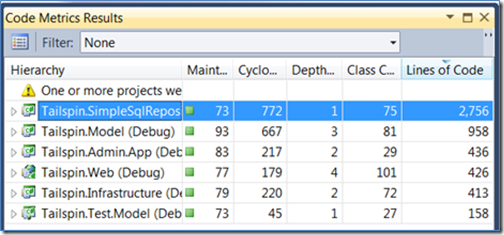
Even a (relatively straightforward) coverage tool like EclEmma for Java can measure instruction, branch, line, method, and type coverage, and as a bonus can compute the cyclomatic complexity. Per metric it can show covered, missed, and total, as well as the percentage of covered items. Which of those should be used? Is it a good idea to monitor all forms of coverage at all levels?

Again, what you measure should depend on your goal.

If your project is just starting to test systematically, a useful goal will be to identify classes where a lot can be gained by adding tests. Then it makes sense to start measuring at the coarse class or method level, in order to identify classes most in need of testing. If, on the other hand, most code is reasonably well tested, looking at missed branches may provide the most insight

The general rule is to start as simple as possible (just line coverage will do), and then to add alternative metrics when the simpler metric does not lead to new insights any more.

Additional forms of coverage should be different from (orthogonal to) the existing form of coverage used. For example, line coverage and branch coverage are relatively similar. Thus, measuring branch coverage besides line coverage may not lead to many additional cases to test (depending on your code). Mutation coverage, dataflow-based coverage, or state-machine based coverage, on the other hand, are much more different from line coverage. Thus, using one of those may be more effective in increasing the diversity of your test cases.

Putting Coverage to Good Use

Managers that are aware of the above pitfalls, can certainly put coverage to good use. Here are a few ways, taken from Glover’s classic Don’t be fooled by the coverage report:

Sun and Snow

src: flickr

  1. “Code without corresponding tests can be more challenging to understand, and is harder to modify safely. Therefore, knowing whether code has been tested, and seeing the actual test coverage numbers, can allow developers and managers to more accurately predict the time needed to modify existing code.” — I can only agree.

  2. “Monitoring coverage reports helps development teams quickly spot code that is growing without corresponding tests” — This happens: see our paper on the co-evolution of test and production code)

  3. “Given that a code coverage report is most effective at demonstrating sections of code without adequate testing, quality assurance personnel can use this data to assess areas of concern with respect to functional testing.” — A good reason to combine user story acceptance testing with coverage analysis.

Summary

Test coverage analysis is an important tool that any development team taking testing seriously should use.

More than anything else, coverage analysis is a reviewing tool that you can use to improve your own (test) code, and to to evaluate someone else’s code and test cases.

Coverage numbers can not be used as a key performance indicator (KPI) for project success. If your manager uses coverage as a KPI, make sure he is aware of the pitfalls.

Coverage analysis is useful to managers: If you are a team lead, make sure you understand test coverage. Then use coverage analysis as a way to engage in discussion with your developers about their (test) code and the team’s test strategy.

Further reading

  1. Eric Bouwers, Joost Visser, and Arie van Deursen. Getting what you Measure: Four common pitfalls in using software metrics for project management. Communications of the ACM, 55(7): 54-59, 2012.
  2. Andrew Glover. In pursuit of code quality: Don’t be fooled by the coverage report. IBM Developer Works blog post, January, 2006.
  3. Martin Fowler. Test Coverage. http://martinfowler.com/bliki/TestCoverage.html, 17 April 2012.
  4. Alberto Savoia. How Much Unit Test Coverage Do You Need? – The Testivus Answer. Artima Forum, 2007. (Also listed as answer to the Stackoverlfow question “What is reasonable code coverage and why?“).
  5. Brian Marick. How to misuse code coverage, 1999
  6. Cem Kaner. Software Negligence and Testing Coverage (Appendix A lists 101 coverage criteria). Proceedings of STAR 96
    (Fifth International Conference on Software Testing, Analysis, and Review), 1996.
  7. Zhu, Hall, May. Software Unit Test Coverage and Adequacy. ACM Computing Surveys, 1997.
  8. Andy Zaidman, Bart Van Rompaey, Arie van Deursen, and Serge Demeyer. Studying the co-evolution of production and test code in open source and industrial developer test processes through repository mining (open access). Empirical Software Engineering 16:325–364, 2011.
  9. Dimitrios Athanasiou. Constructing a Test Code Quality Model and Empirically Assessing its Relation to Issue Handling Performance (pdf). Master’s Thesis, Delft University of Technology, 2011.

© Arie van Deursen, 2013.
Image credits: Flickr.
Source featured image: flickr

Speaking in Irvine on Metrics and Architecture

End of last year I was honored to receive an invitation to present in the Distinguished Speaker Series at the Insitute for Software Research at University of California at Irvine.

I quickly decided that the topic to discuss would be our research on software architecture, and in particular our work on metrics for maintainability.

Irvine is one of the world’s leading centers on research in software architecture. The Institute of Software Research is headed by Richard Taylor, who supervised Roy Fielding when he wrote his PhD thesis covering the REST architectural style, and Nenad Medvidovic during his work on architectural description laguages. Current topics investigated at Irvine include design and collaboration (André van der Hoek, and David Redmiles of ArgoUML fame), software analyis and testing (James Jones), and programming laguages (Cristina Lopes), to name a few. An overview of the group’s vision on software architecture can be found in their recently published textbook. In short, I figured that if there is one place to present our software architecture research it must be Irvine.

The talk (90 minutes) itself will be loosely based on my keynote at the Brazilian Software Engineering Symposium (SBES 2012), which in turn is based on joint research with Eric Bouwers and Joost Visser (both from SIG). I’ll post the slides when I’m done. The full slides are available on speakerdeck, but here’s the storyline along with some references.

A Software Risk Assessment (from )

A Software Risk Assessment (source: ICSM 2009)

The context of this research is a software risk assessment, in which a client using a particular system seeks independent advice (from a consultant) on the technical quality of the system as created by an external supplier.

How can the client be sure that the system made for him is of good quality? In particular, will it be sufficiently maintainable, if the business context of the system in question changes? Will it be easy to adapt the system to the ever changing world?

In situations like these, it is quintessential to be able to make objective, evidence-based statements about the maintainability of the system in question.

Is this possible? What role can metrics play? What are their inherent limitations? How can we know that a metric indeed captures certain aspects of maintainability? How should metric values be interpreted? How should proposals for new metrics be evaluated?

Simple answers to these questions do not exist. In this talk, I will summarize our current progress in answering these questions.

I will start out by summarizing four common pitfalls when using metrics in a software development project. Then, I will describe a metrics framework in which metrics are put into context by means of benchmarking and a quality model. Subsequently, I’ll zoom in on architectural metrics, focusing on metrics for encapsulation. I will discuss a proposal for a new metric, as well as its evaluation. The evaluation comprises both a quantitative assessment (using repository-mining) of its construct validity (doest it measure encapsulation?), as well as qualitative assessments of the usefulness in practice (by interviewing consultants who applied the metrics in their day to day work).

Based on this, I will reflect on the road ahead for empirical research in software metrics and architecture, emphasizing the need for shared datasets, as well as the use of qualitative research methods to evaluate practical impact.

The talk is scheduled for Friday March 15, in Irvine — I sincerely hope to see you there!

If you can’t make it, Eric Bouwers and I will present a 3.5-hour tutorial based on this same material at ICSE 2013, in May in San Francisco. The tutorial will be more interactive, taking your experience into account as well where possible, and it will have a stronger emphasis on metrics (based on SIG’s 10 year experience with using metrics in industry). Register now for our tutorial, and looking forward to seeing you there!


See also:

Design for Upgradability and the Rails DigiD Outage

On January 9th, the Dutch DigiD system was taken offline for 9 hours. The reason was a vulnerability (CVE-2013-0155 and CVE-2013-0156) in the underlying Ruby on Rails system used. According to the exploit, it enables attackers to bypass authentication, inject SQL, perform a denial of service, or execute arbitrary code.

DigiD is a Dutch authentication system used by over 600 organizations, including the national taxes. Over 9 million Dutch citizens have a DigiD account, which they must use for various interactions with the government, such as filing taxes electronically. The organization responsible for DigiD maintenance, Logius, decided to take DigiD off line when it heard about the vulnerability. It then updated the Rails system to a patched version. The total downtime of DigiD was about 9 hours (from 12:20 until 21:30). Luckily, it seems DigiD was never comprimised.

The threat was real enough, though, as illustrated by the Bitcoin digital currency system: the Bitcoin currency exchange called Vircurex actually was compromised. According to Vircurex, it was able to “deploy fixes within five minutes after receiving the notification from the Rails security mailing list.”

To better understand the DigiD outage, I contacted spokesman Michiel Groeneveld from Logius. He stated that (1) applying the fix was relatively easy, and that (2) most of the down time was caused by “extensively testing” the new release.

Thus, the real lesson to be learned here is that speed of upgrading is crucial to reduce downtime (ensure high availability) in case a third party component turns into a security vulnerability. The software architect caring about both security and availability, must apply design for upgradability (categorized under replaceability in ISO 25010).

Any upgrade can introduce incompatibilities. Even the patch for this Rails vulnerability introduced a regression. Design for upgradability is about dealing with such regressions. It involves:

  1. Isolation of depedencies on the external components, for example through the use of wrappers or aspects in order to reduce the impact of incompatibilities.

  2. Dependency hygiene, ensuring the newest versions of external components are used as soon as they are available (which is good security policy anyway). This helps avoid the accumulation of incompatibilities, which may cause updates to take weeks rather than minutes (or even hours). Hot security fixes may even be unavailable for older versions: For Ruby on Rails, which is now in version 3.x, the most popular comment at the fix site was a telling “lots of love from people stuck on 2.3

  3. Test automation, in order to reduce the execution time of regression tests for the system working with the upgraded component. This will include end-to-end system tests, but can also include dedicated tests ensuring that the wrappers built meet the behavior expected from the component.

  4. Continuous deployment, ensuring that once the source code can deal with the upgraded library, the actual system can be deployed with a push on the button.

None of these comes for free. In other words, the product owner should be willing to invest in these. It is the responsibility of the architect to make clear what the costs and benefits are, and what the risks are of not investing in isolation, dependency hygiene, test automation, and continuous deployment. In this explanation, the architect can point to additional benefits, such as better maintainability, but these may be harder to sell than security and availability.

This brings me to two research connections of this case.

The first relates to regression testing. A hot fix for a system that is down is a case where it actually matters how long the execution of an (automated) regression test suite takes: test execution time in this case equals down time. Intuitively, test cases covering functionality for which Rails is not even used, need not be executed. This is where the research area of selective regression testing comes in. The typical technique uses control flow analysis in order to reduce a large regression test suite given a particular change. This is classic software engineering research dating back to the 90s: For a representative article have a look at Rothermel and Harrold’s Safe, Efficient Regression Test Selection Technique.

Design for upgradability also relates to some of the research I’m involved in.
What an architect caring about upgradability can do is estimate the anticipated upgrading costs of an external component. This could be based on a library’s “compatibility reputation”. But how can we create such a compatibility rating?

At the time of writing, we are working on various metrics that use a library’s release history in order to predict API stability. We are using the (huge) maven repository to learn about breaking changes in libraries in the wild, and we are investigating to what extent encapsulation practices are effective. With that in place, we hope to be able to provide decision support concerning the maintainability costs of using third party libraries.

For our first results, have a look at our ICSM 2012 paper on Measuring Library Stability Through Historical Version Analysis — for the rest, stay tuned, as there is more to come.

EDIT (February 4, 2013)

For a more detailed account of the impact of the Rails vulnerabilites, have a look at What The Rails Security Issue Means For Your Startup by Patrick McKenzie. The many (sometimes critical) comments on that post are also an indication for how hard upgrading in practice is (“How does this help me … when I have a multitude of apps running some Rails 1.x or 2.x version?“).

An interesting connection with API design is provided by Ned Batchelder, who suggests to rename .load and .safe_load to .dangerous_load and .load, respectively (in a Python setting in which similar security issues exist).

EDIT (April 4, 2013)

As another (separate) example of an urgent security fix, today (April 4, 2013), the PostgreSQL Global Development Group has released a security update to all current versions of the PostgreSQL database system. The most important security issue fixed in this release, CVE-2013-1899, makes it possible for a connection request containing a database name that begins with “-” to be crafted that can damage or destroy files within a server’s data directory.

Here again, all users of the affected versions are strongly urged to apply the update immediately, illustrating once more the need to be able to upgrade rapidly.